Topology & Hypergraphs
Understanding topology through hypergraphs
Persistence diagrams summarize the presence of loops in data. However, they do not inform us of where the loops are. Can we understand which points are “integral” to the overall structure of the data? The goal is to develop a quantification of each point in the data according to its contribution to the overall structure.
There are two challenges. The first is that, given a persistence diagram, localizing the loops in a concise and interpretable way is an NP-hard problem. The second is the lack of methods to consolidate all loop information.
To address the first challenge, I developed a method called minimal generators that outputs a small and interpretable collection of data (generators) that represents the loops. I utilize a recent technique of performing the optimization over rational coefficients to circumvent the NP-hardness of the problem.
To consolidate all generators, my collaborators and I utilized hypergraphs, a generalization of a graph whose edges are collections of two or more vertices. We constructed a PH-hypergraph that has the original data as the vertex set and whose hyperedges are the generators of a persistence diagram. To encode the “importance” of each point of the persistence diagram, we weighed the hyperedge according to the persistence (the distance between a point and the diagonal line in the persistence diagram). Figure 1 illustrates the construction.
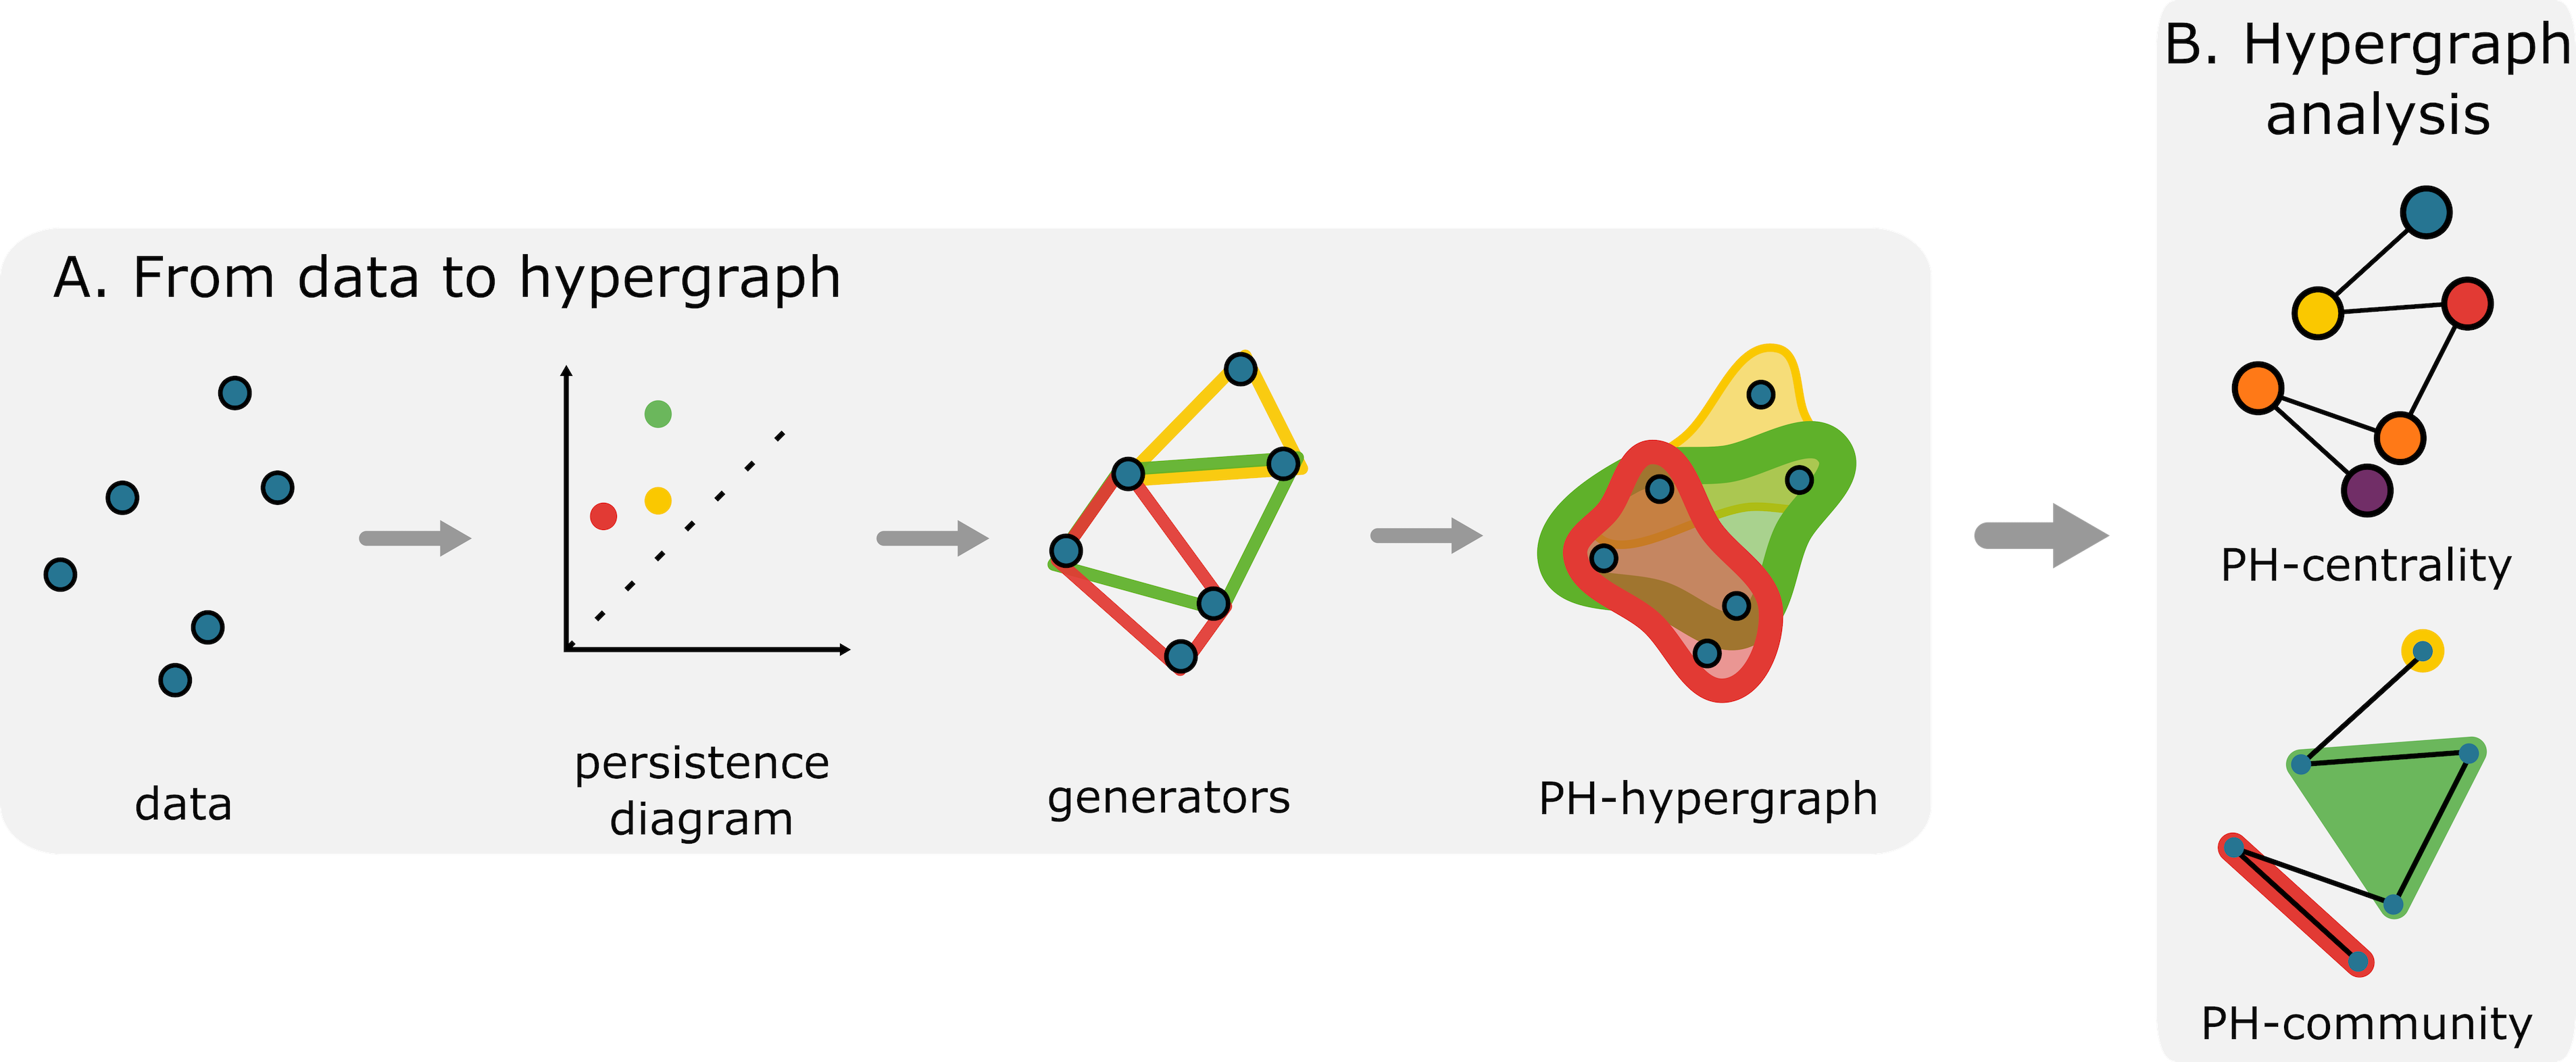
We use graph theory and network science to study the PH-hypergraph. We first compute hypergraph centrality, which ranks the original data according to their participation in large loops. We also perform community detection, which partitions the data according to how often a collection of points constitutes a shared loop. See Figure 1B for the complete method. See Figure 2 for examples of outputs.
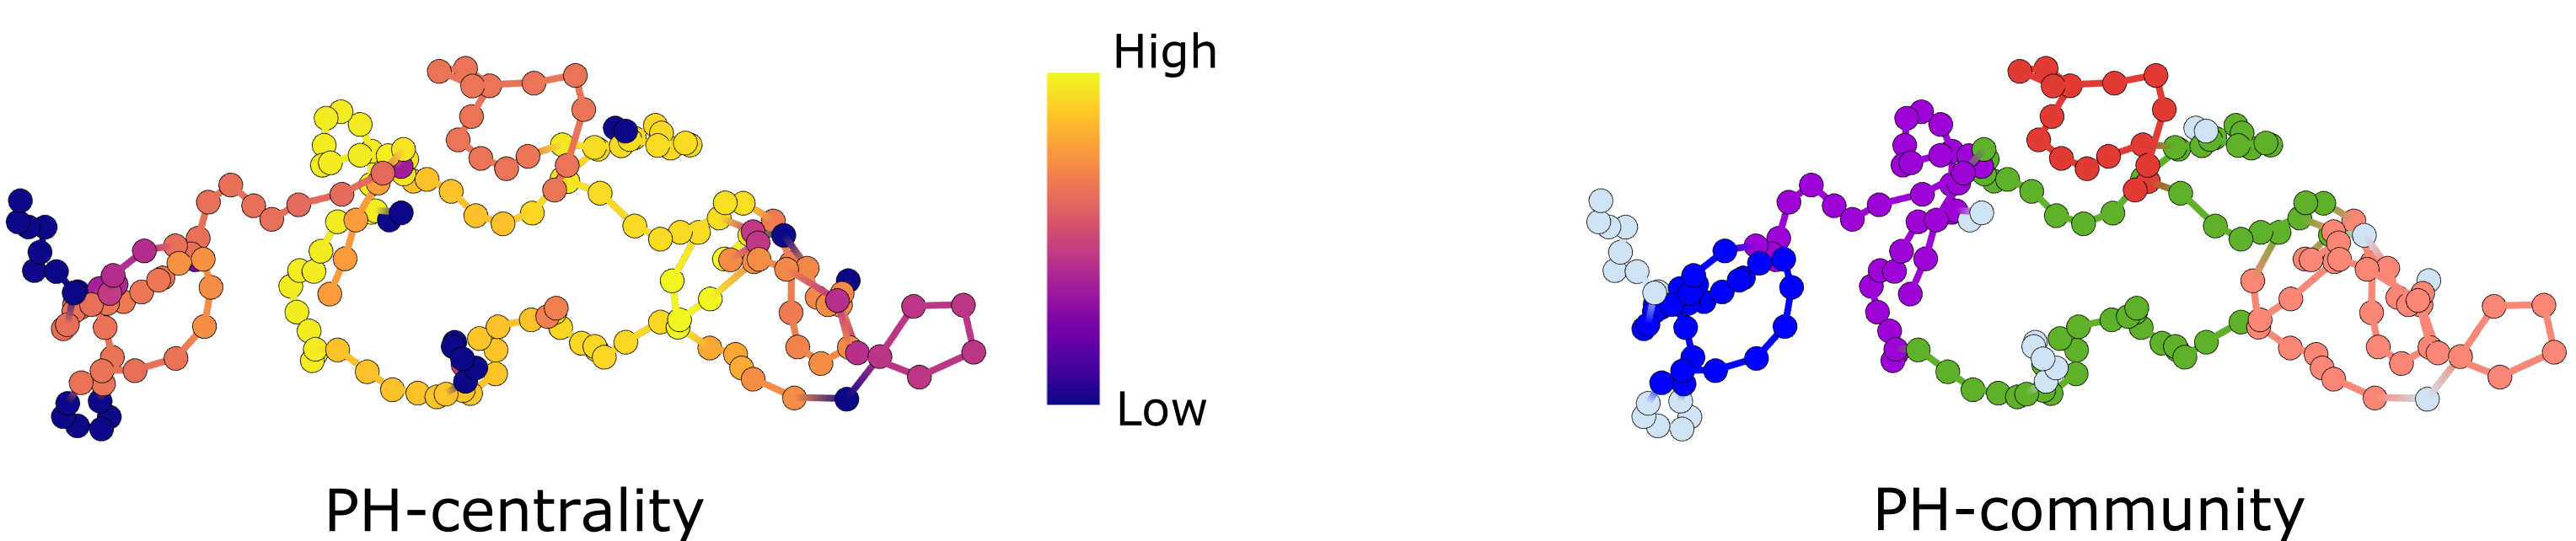
The method, called hyperTDA, identifies subsets of data integral to the overall structure and partitions the data into functional modules. We validated our method on simulated and experimental data, including diffusion of particles and animal movement trajectories.
Preprint: Hypergraphs for multiscale cycles in structured data
Code: github:hyperTDA
Joint work with Agnese Barbensi (University of Melbourne), Christian Madsen (University of Melbourne), Deborah Ajayi (University of Ibadan), Heather Harrington (University of Oxford), and Michael Stumpf (University of Melbourne).