topology & neuroscience
A topological approach to neural encoding
What does it mean for there to be circular structures in neural activity?
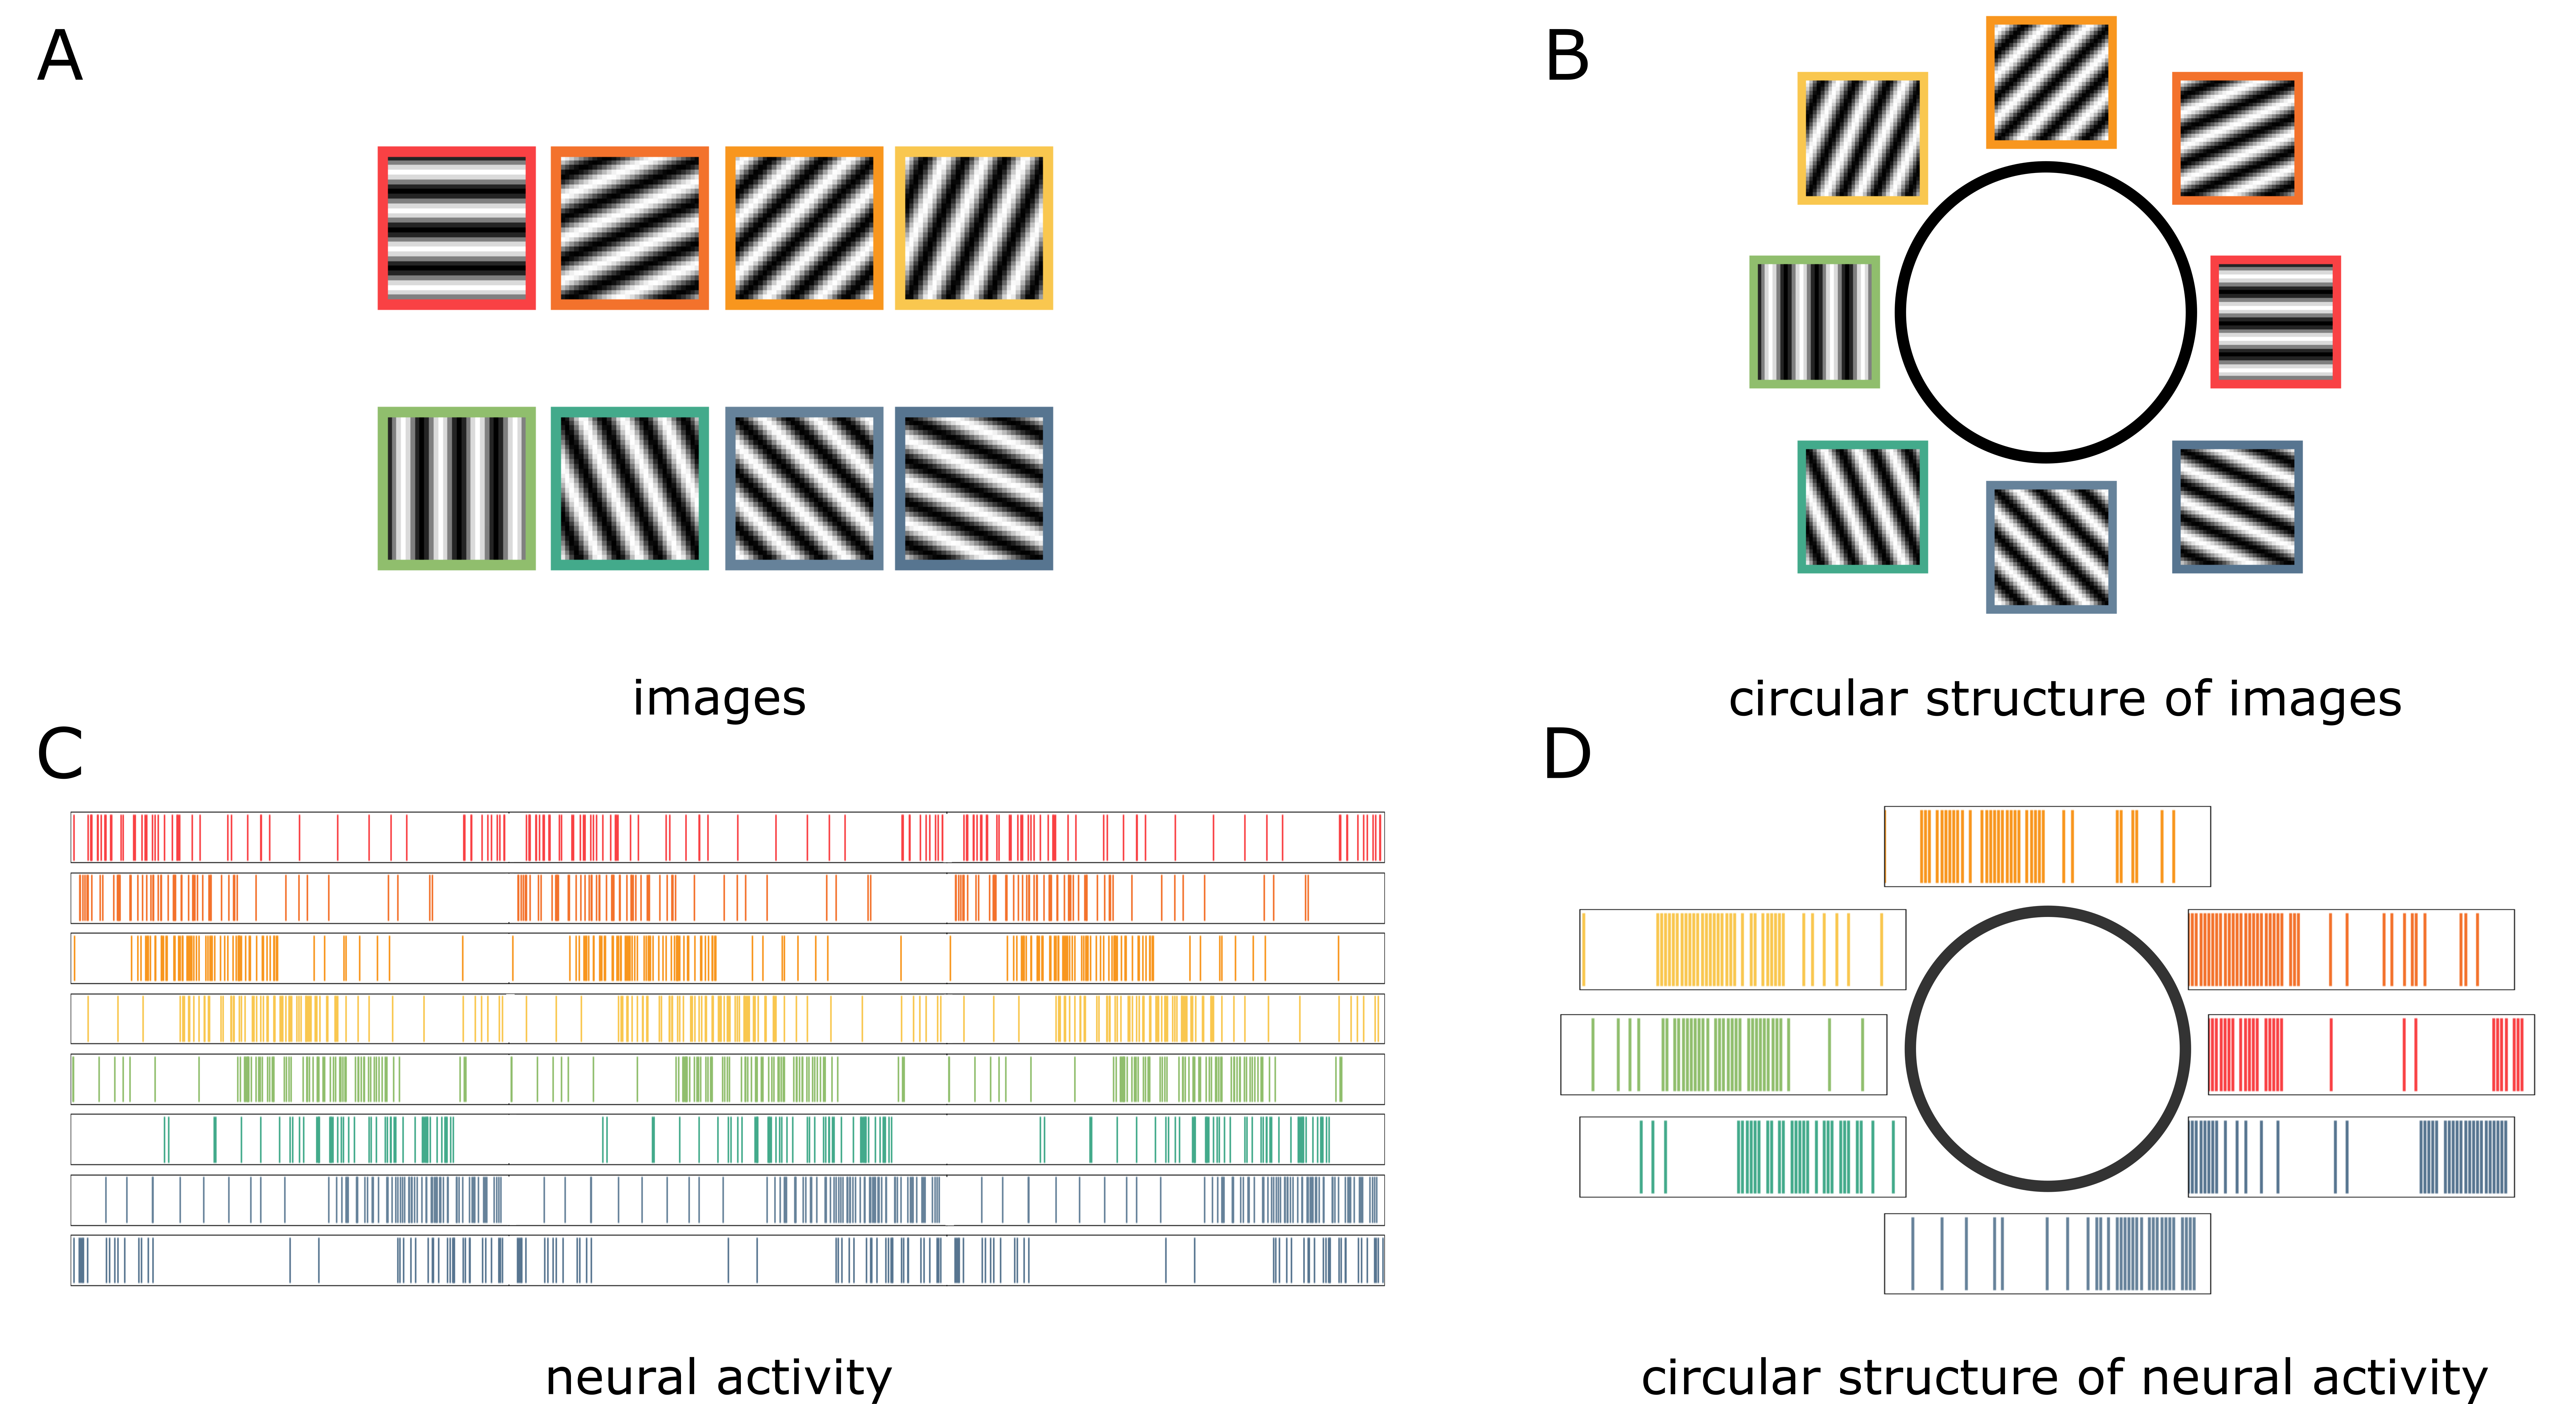
Consider a collection of images with different orientations shown in Figure 1A. The red and dark orange images have high similarity, whereas the red and green images have low similarity. What would happen if we arranged the eight images in a way that respects this similarity? The images would be arranged in a circular fashion, as shown in Figure 1B.

Similarly, consider a collection of neural activities (called spike trains) shown in Figure 1C. Each row indicates the activity of a single neuron over some time period. The vertical line indicates the neuron’s firing at a corresponding time. If we observe the neuron for, say \(M\) time intervals, then each spike train is a binary vector in \(\mathbb{R}^M\). Given two spike trains \(s_1\) and \(s_2\), let’s measure similarities between two spike trains as the amount one needs to “slide” \(s_1\) to “match” with \(s_2\). Then, the red spike train is similar to the dark orange spike train, but it is quite dissimilar to the green spike train. Again, if we were to arrange the spike trains in a way that respects this similarity, we would arrange them in a cyclic manner (Figure 1D).
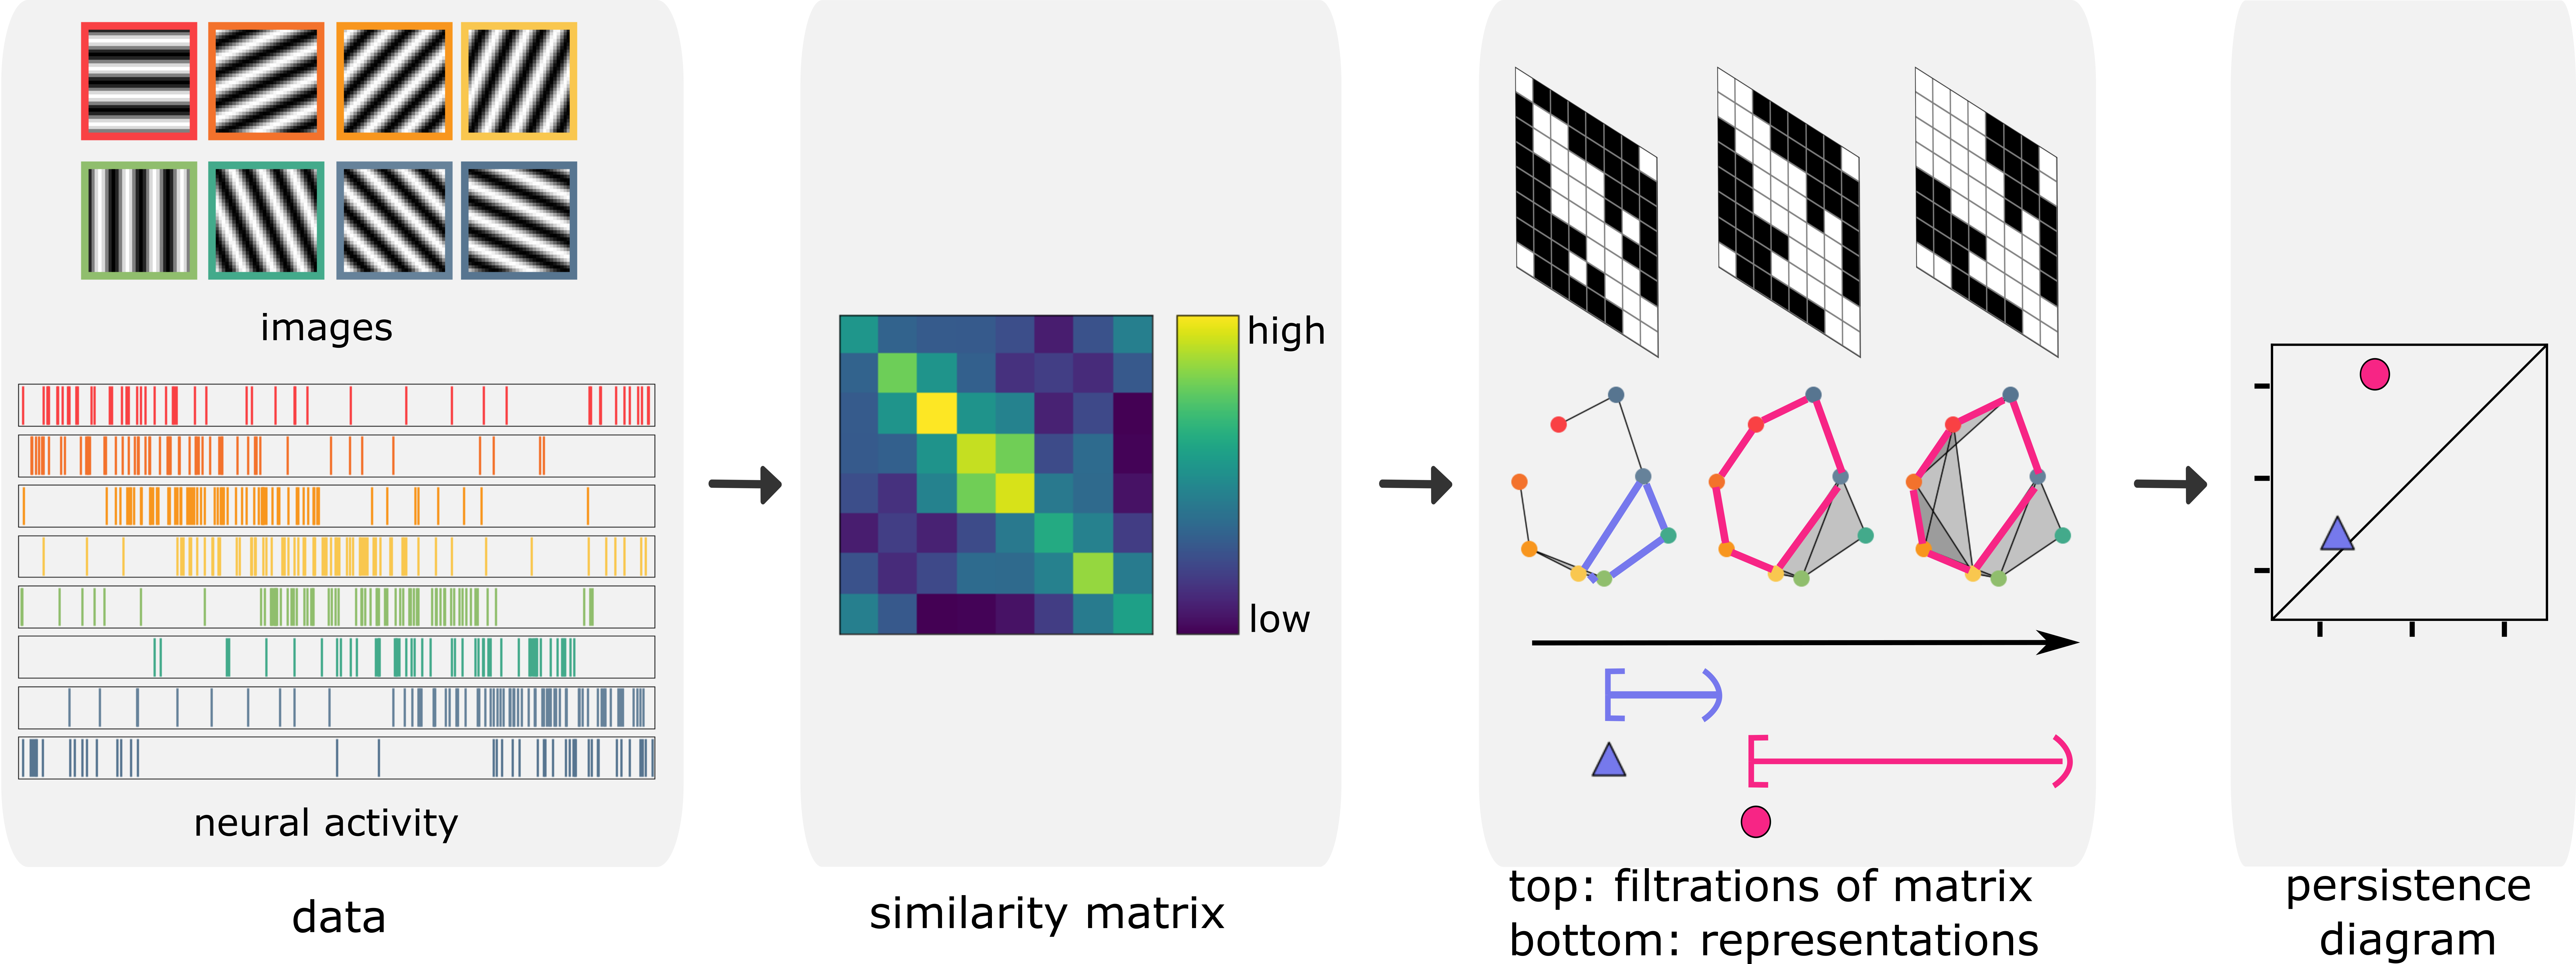
Now, suppose there are many images and long spike trains that we cannot make the arrangements by hand. How would a computer recognize that these high-dimensional data contain cyclic structures? Let \(P\) denote the point cloud representing a system of interest, such as the collection of stimulus or neural activity. We calculate the similarity between every pair of elements in the system. We construct a representation of the system as we vary the similarity level by a sequence of simplicial complexes. The loops in this sequence are summarized by a persistence diagram, where the points far from the diagonal represent the large loops. See the following figure.

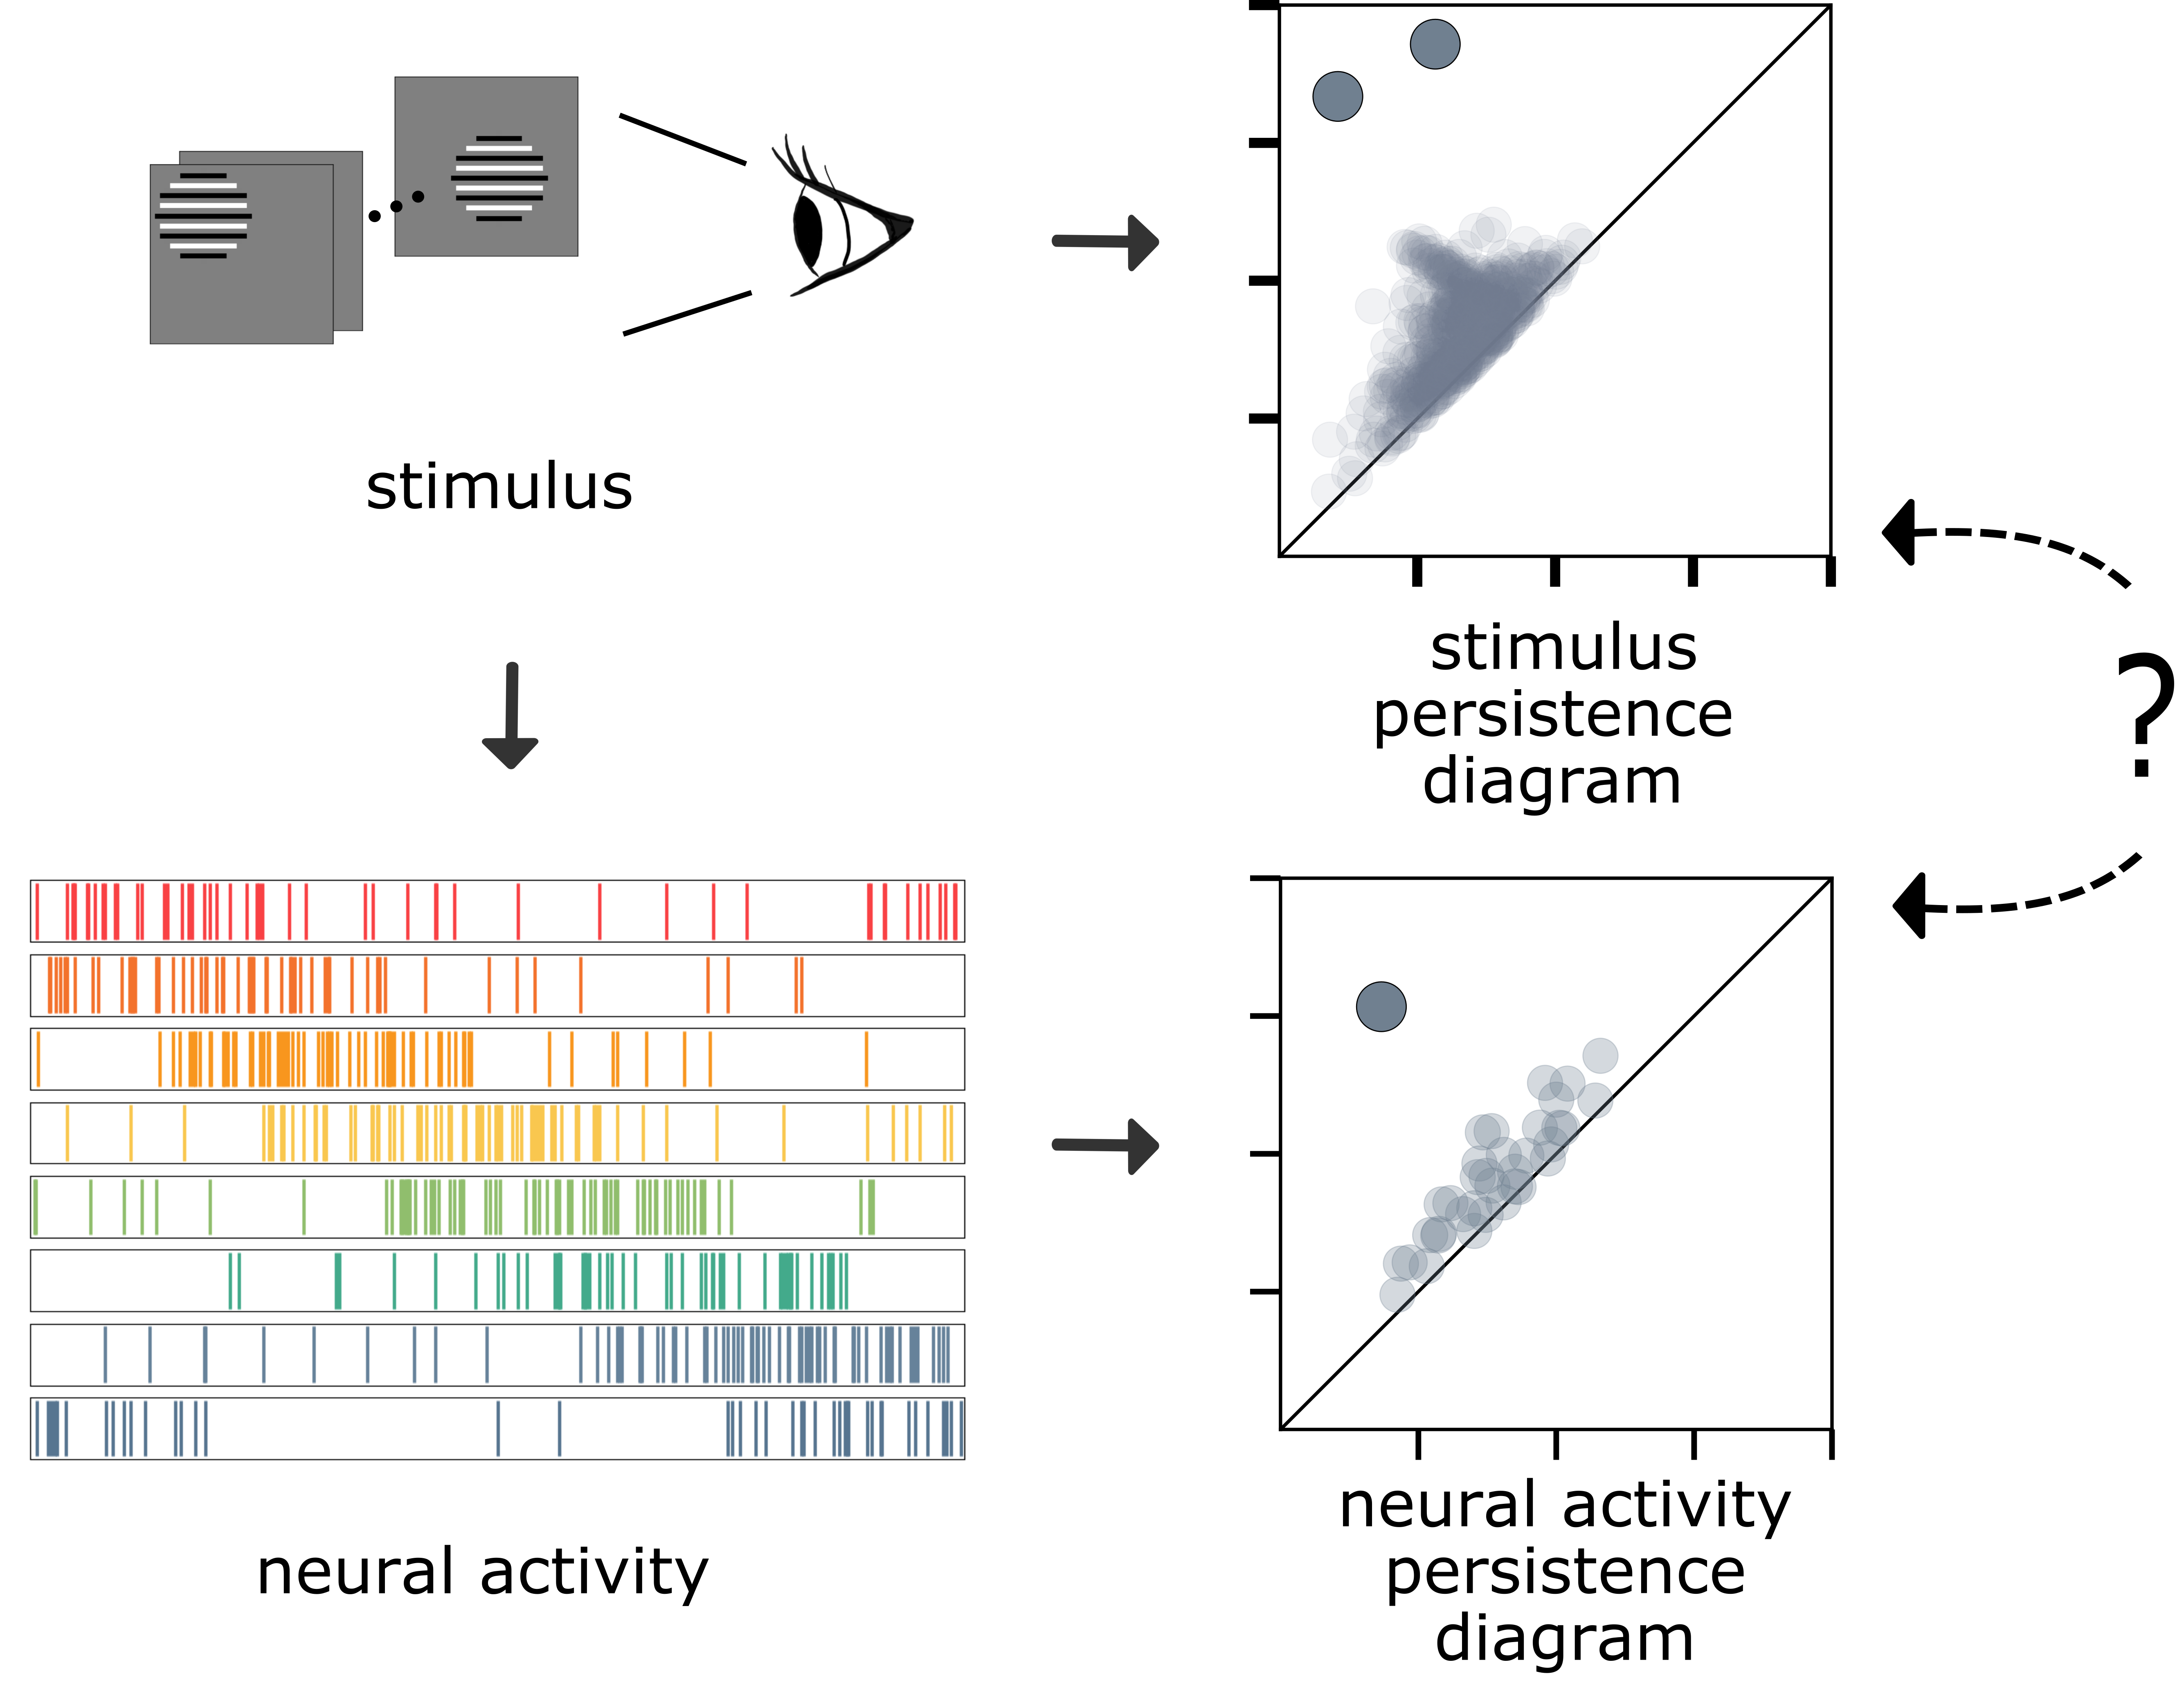
So far, we have seen that persistence diagrams can indicate if a collection of images or spike trains contain circular structures. Consider a hypothetical experiment in which we present a stimulus video to a mouse while measuring its neural activity. Let’s assume that the persistence diagram indicates that there are two circular structures in the stimulus and one circular structure in the neural activity. Is the unique circular feature in the neural activity reflecting one of the circular features in the stimulus? If so, which one? Such questions are topological manifestations of fundamental problems in neuroscience called neural encoding that study how neurons represent information.

To address the above questions, I developed a framework for comparing persistence diagrams called the analogous bars method.
The methods paper has been accepted in the Journal of Applied and Computational Topology, conditional on minor revisions. A follow-up paper implementing the method on simulated and experimental neuroscience datasets is under preparation.
Preprint: Persistent Extension and Analogous Bars: Data-Induced Relations Between Persistence Barcodes.
Code: github: analogous bars
Joint work with Chad Giusti (U. Delaware) and Robert Ghrist (U. Penn).